Road Surface Reconstruction Dataset
Fine-grained road reconstruction recovers the road surface profile up to the macro-texture level. It provides the possibility of predicting the vehicle response in advance, thus benefiting decision making and control of autonomous vehicles to improve the driving safety and comfort.
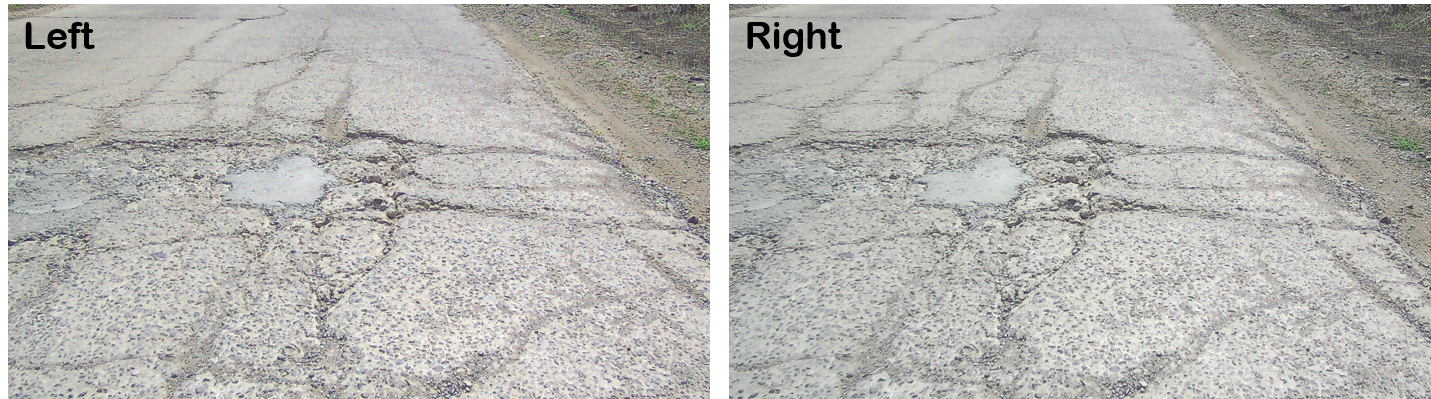
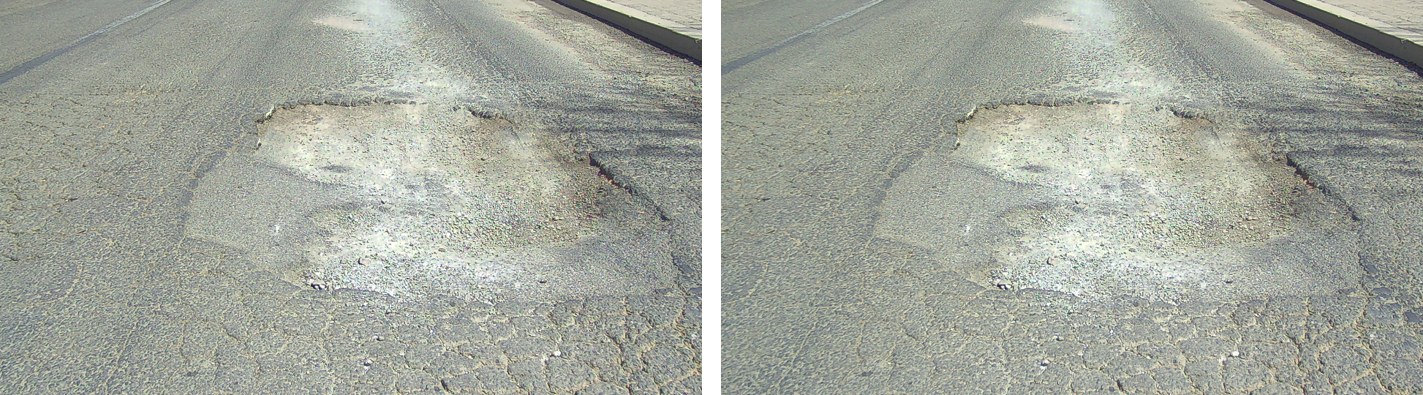
The RSRD provides high-resolution, high-accuracy, and multi-condition stereo images and point clouds. It contains 2800 data pairs with dense point cloud labels and 13K pairs with sparse labels. This dataset can act as a benchmark for monocular depth estimation, multi-view stereo, binocular stereo matching, structure from motion, or direct point cloud processing.
Data Acquisition
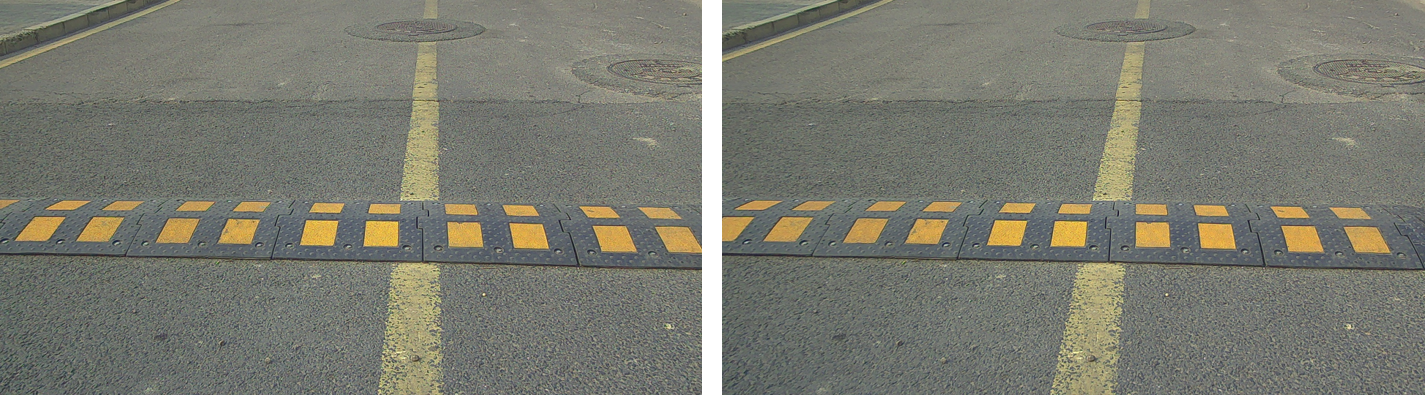
The raw data is acquired with our real-vehicle experiment platform with full sensor suit. See the Sensor setup section for more details. The experiments are conducted from March to April, 2023 in Qingdao, China. We searched representative even and uneven roads in urban and rural areas. Data is collected on both concrete and asphalt roads in sunny days.
To reach a higher label accuracy and prevent image motion blur, the velocity is limited under 40 km/h. Since we consider only the road surface area, the horizontal viewing angle of the mechanical rotating LiDAR is set to 100 degrees. The acquisition frequency for the stereo cameras and LiDAR is set to 5Hz.
Multi-frame Point Cloud Fusion
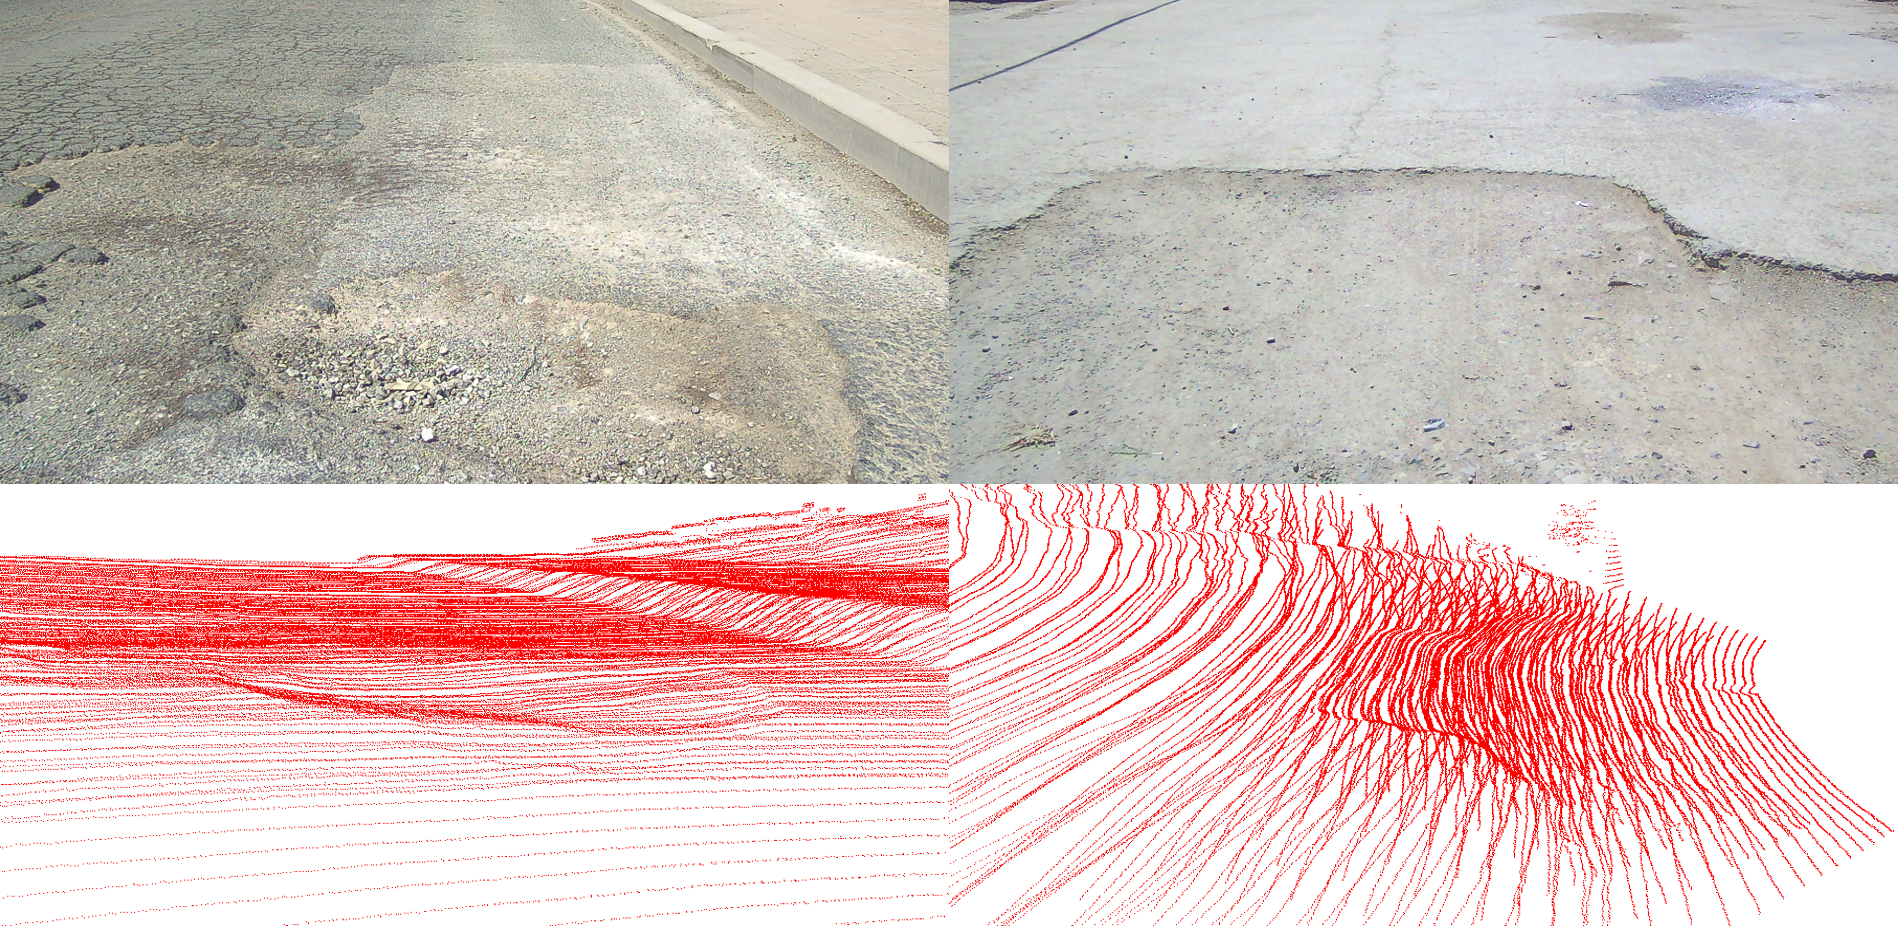
As the single-frame LiDAR point cloud is very sparse, accumulating nearby frames is required for a dense reconstruction. Comparing with the traffic environment, the amplitude of road surface undulation is much smaller (generally 1~2 cm for small rocks or cracks), which indicates a higher requirement for the fusion accuracy.
Motion compensation and initial alignment are first conducted to the nearby 4~6 LiDAR frames with the high-precision IMU and RTK data. Then ICP registration algorithm and the improved forms further fine-tune the alignment transformation.We fine-tune the algorithm parameters in a grid-search manner for every sample to ensure the alignment accuracy.
Dataset Contents
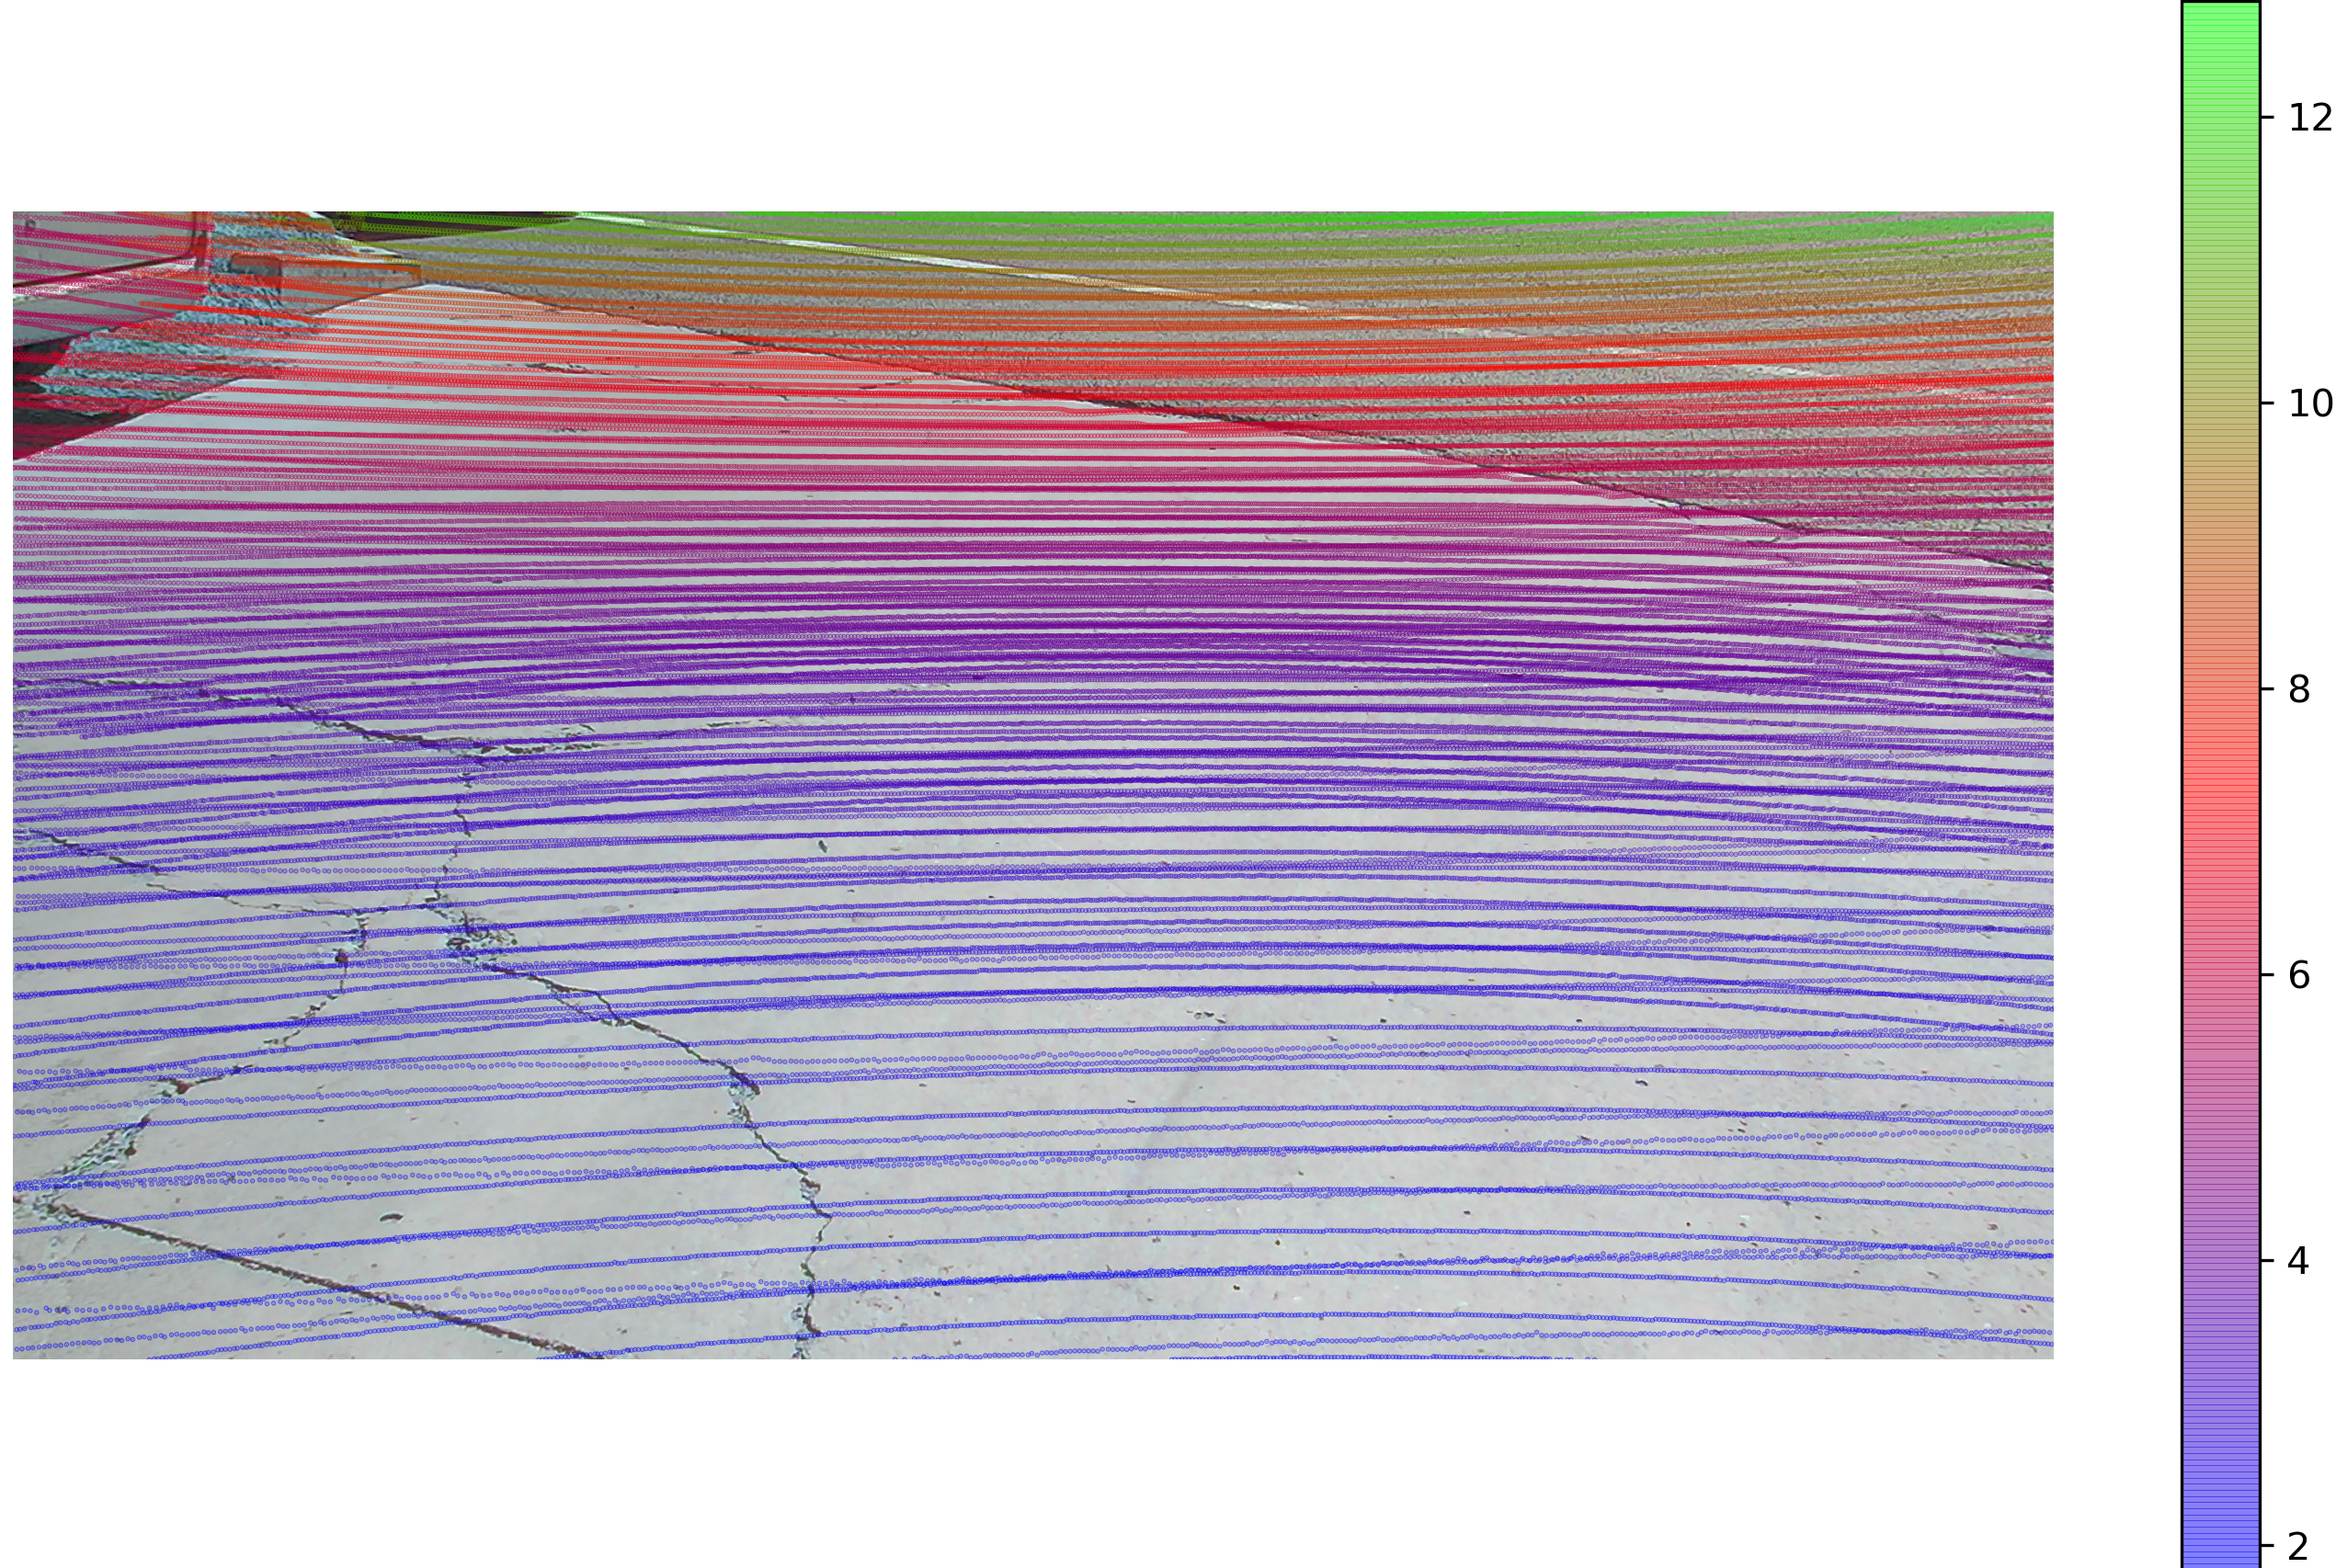
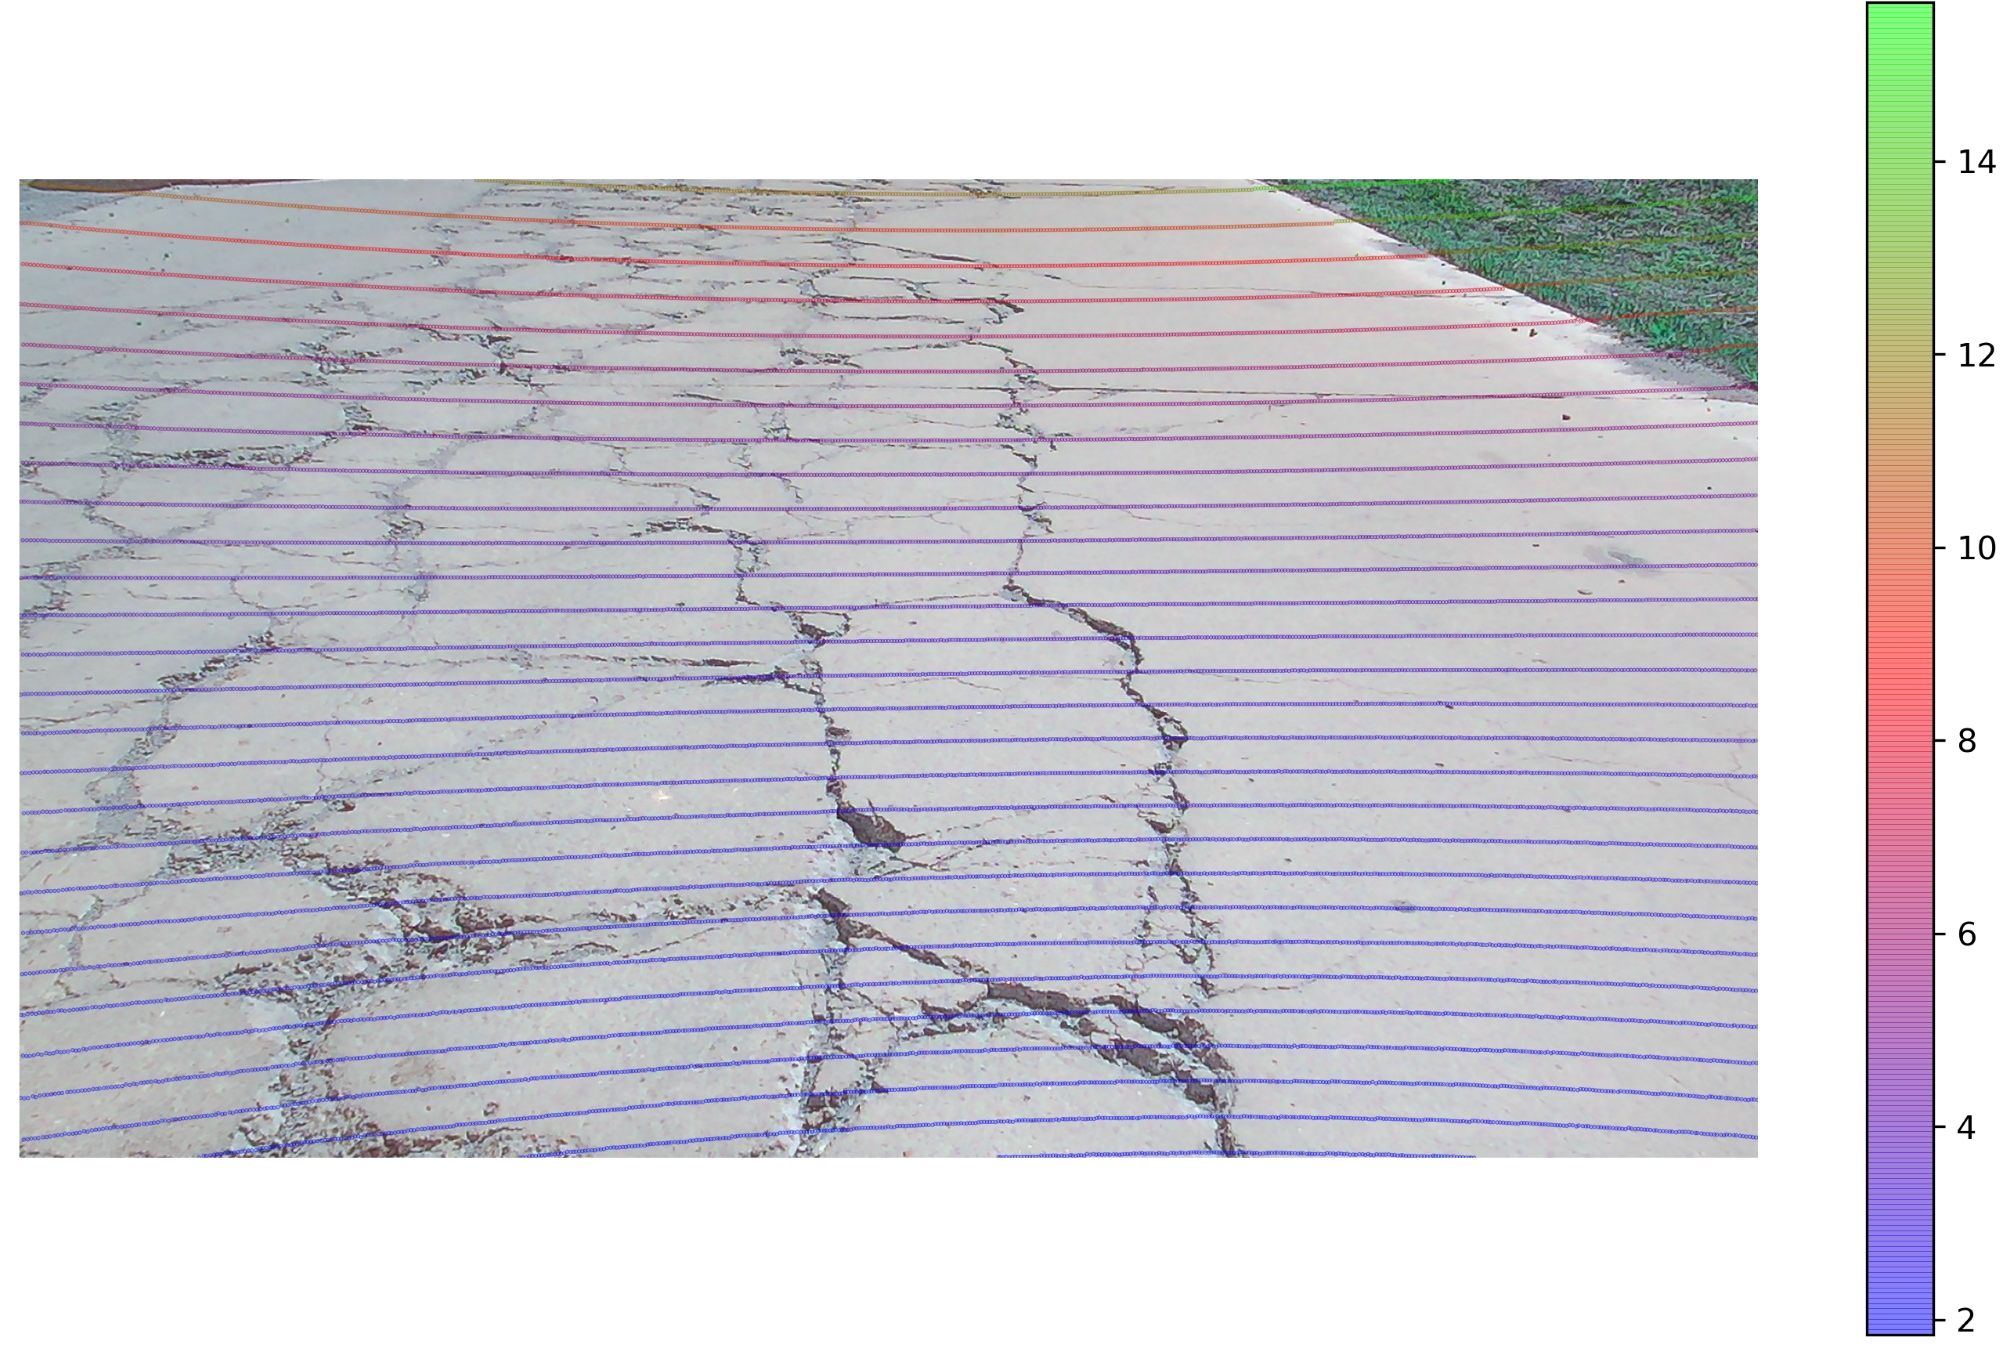
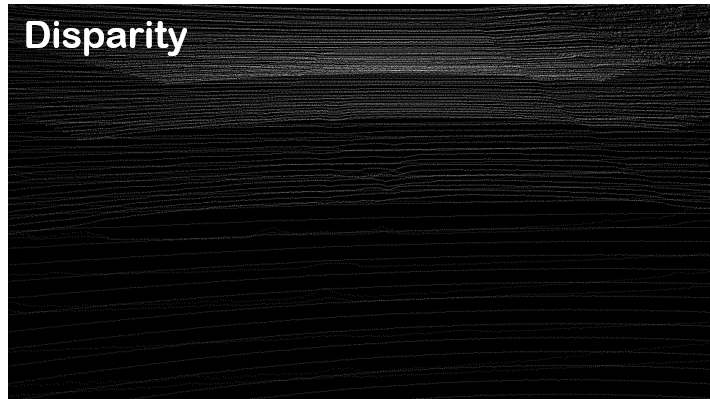
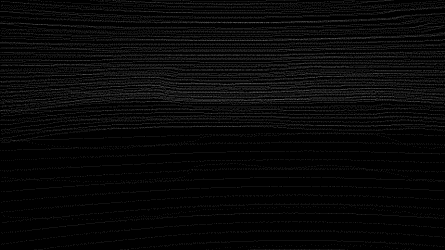
The fused LiDAR frames are then projected onto the image plane of left camera. We generate both the ground-truth disparity and depth maps.
The rectified stereo images are saved in .jpg format with save quality 100. The depth and disparity maps are saved in lossless .png format, and the point clouds are in .pcd format.
The depth and disparity values are multiplied by 256 before saving. Note that for a better registration accuracy, the point clouds may be cropped, and only the points near the camera’s perspective are preserved.
For SfM/MVS or localization applications, we provide 15 continuous sequences each of 8 seconds long. The raw position, pose, and velocity data from the RTK and IMU are included. Refer the development kit for more details. The dataset is divided into train set with 2500 samples and test set with 300 samples.
Further, we provide extra 13K samples with sparse labels (only single frame LiDAR, as shown above). It contains 176 continuous sequences. This sparse sub-set can be used for weakly supervised or unsupervised learning. It’s not divided it into train or test sets.
Statistics and Samples
Precision Evaluation
We evaluate the fusion accuracy on planes such as even roads or road edge stones. The average alignment error in horizontal and vertical direction of road surface is ±1.2cm.
To illustrate the overall precision of the RSRD, we calculate the disparity errors. This metric is a comprehensive performance assessment of the dataset as it involves both the errors in the sensor acquisition, fusion, and calibration processes. We pick corresponding pixels at different positions of the stereo images and calculate their errors with the LiDAR-measured disparity values. Although pixels are discrete, we pick continuous coordinate values with maximum corresponding possibility. The average error is 0.6 pixel, which is at sub-pixel level.
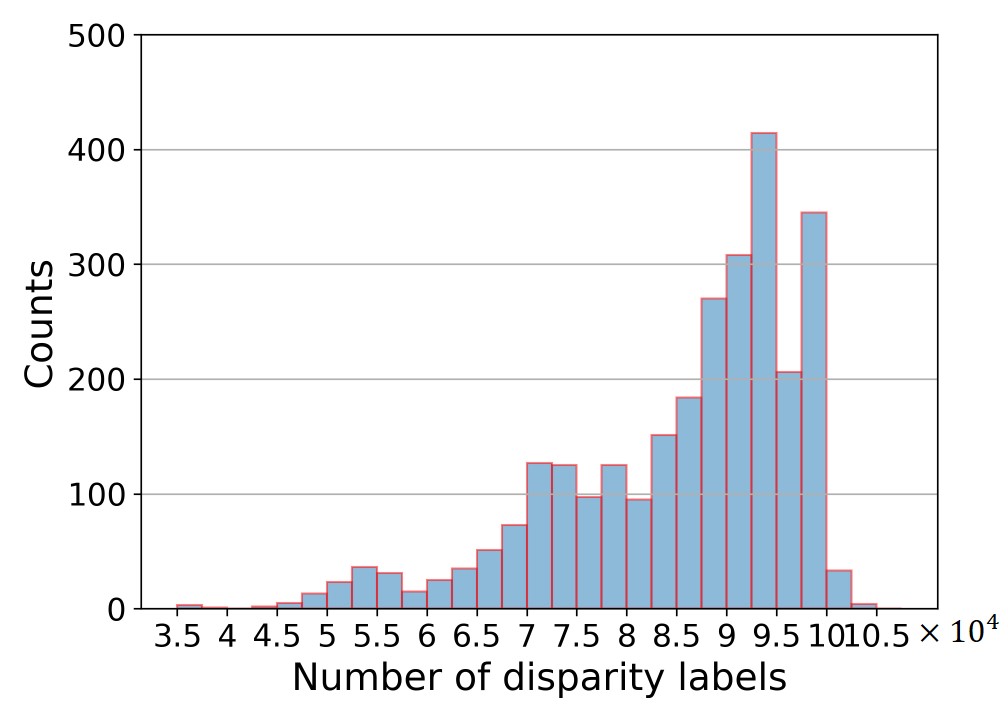
Point Cloud Density
We also evaluate the number of pixels with GT labels of every sample. The histogram is shown below.
Application and Baseline
Stereo matching: [Paper] [Code]
Demo video by stereo matching
Sample 1
Sample 2
Sample 3
Citation
@ARTICLE{zhao2024rsrd,
  author={Zhao, Tong and Xie, Yichen and Ding, Mingyu and Yang, Lei and Tomizuka, Masayoshi and Wei, Yintao},
  journal={Scientific Data},
  title={A road surface reconstruction dataset for autonomous driving},
  year={2024},
  volume={11},
  doi={10.1038/s41597-024-03261-9}}